8 Week8 Temperature and policy
8.1 Summary
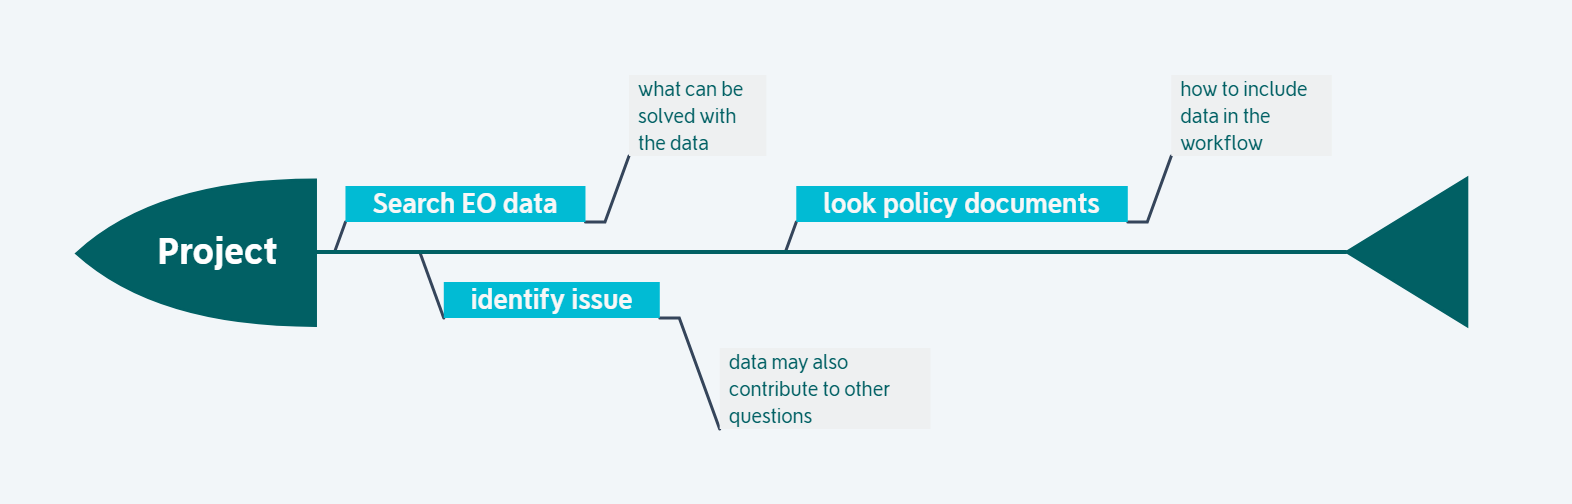
8.1.1 Mind map
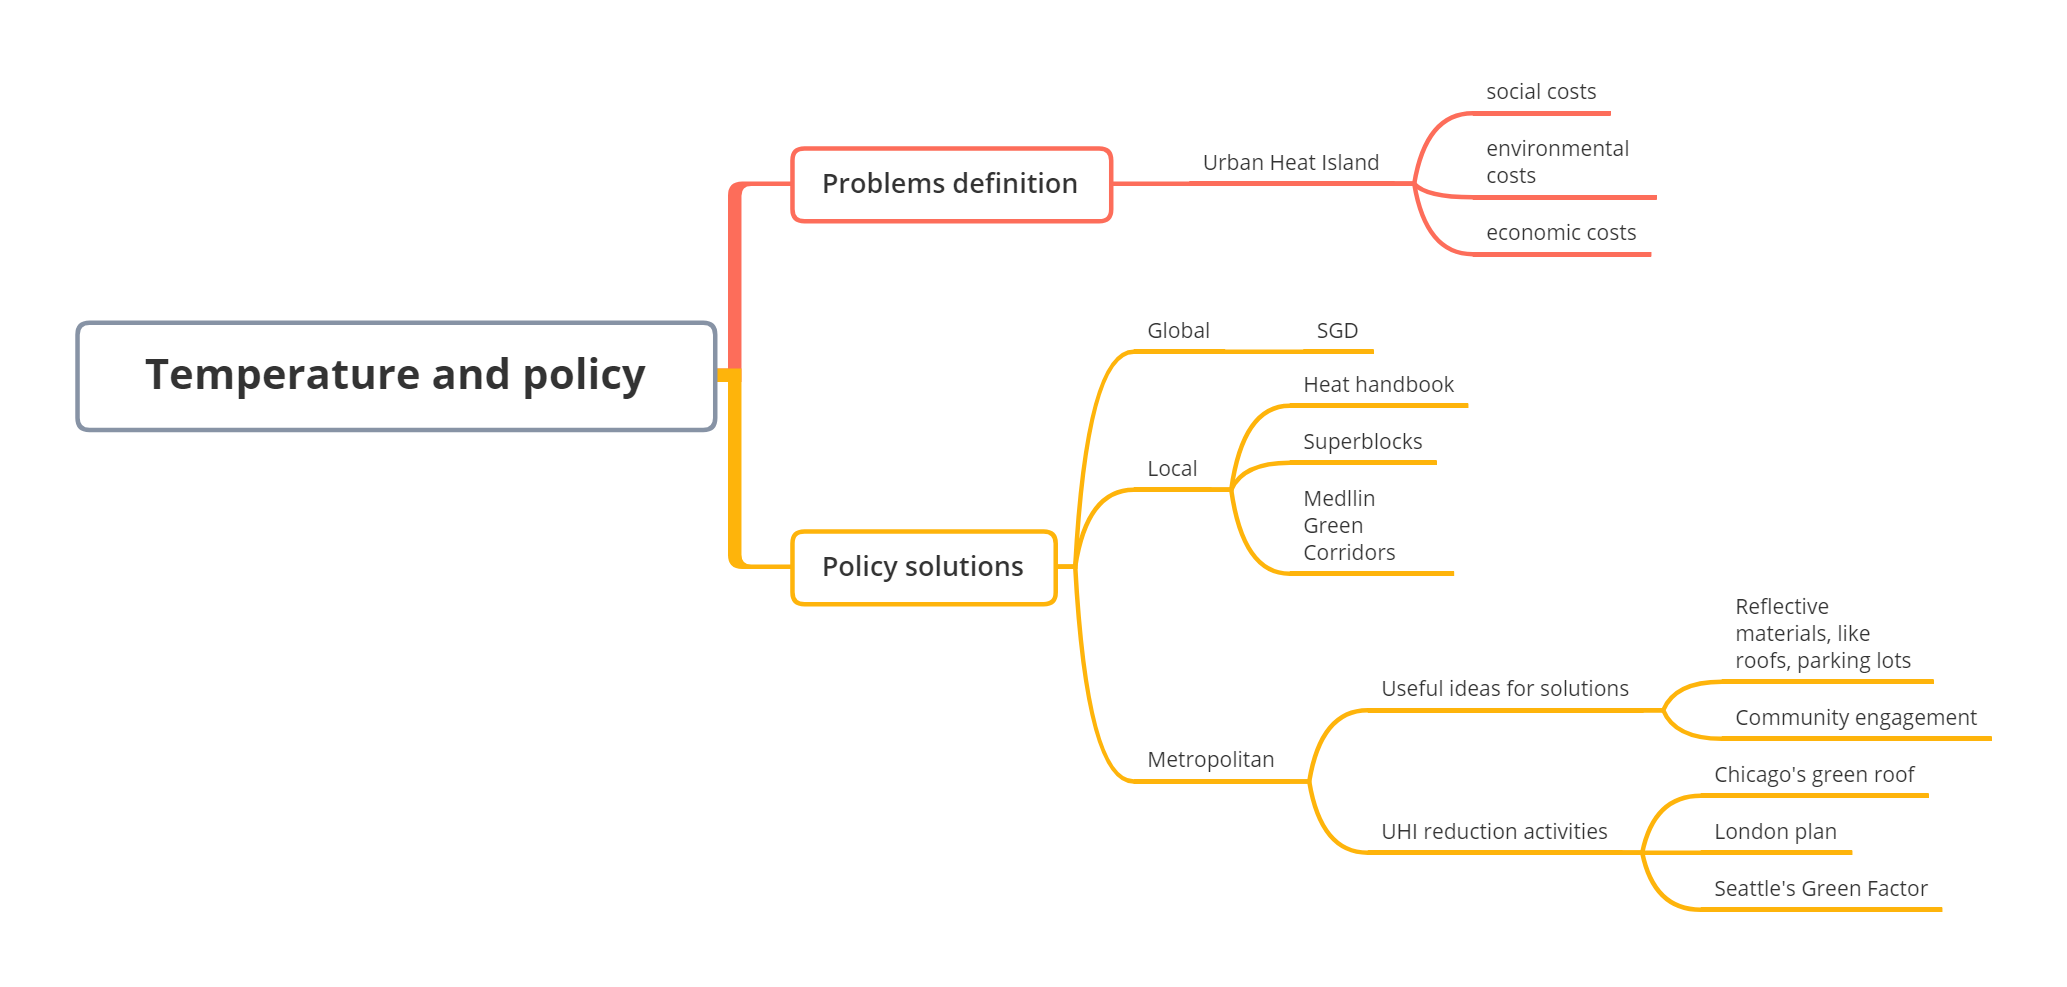
The mind map shows basic structure for this week lecture, and the key point is recognizing the gap among global, local, metropolitan, and involving data analysis. The detailed and data-driven interventions will be great measures to fill the current policy gap in many urban problems, like urban heat island, pollution and so on.
8.1.2 Temperature Problem Definition
8.1.2.1 Urban Heat Island (UHI)
What is UHI?
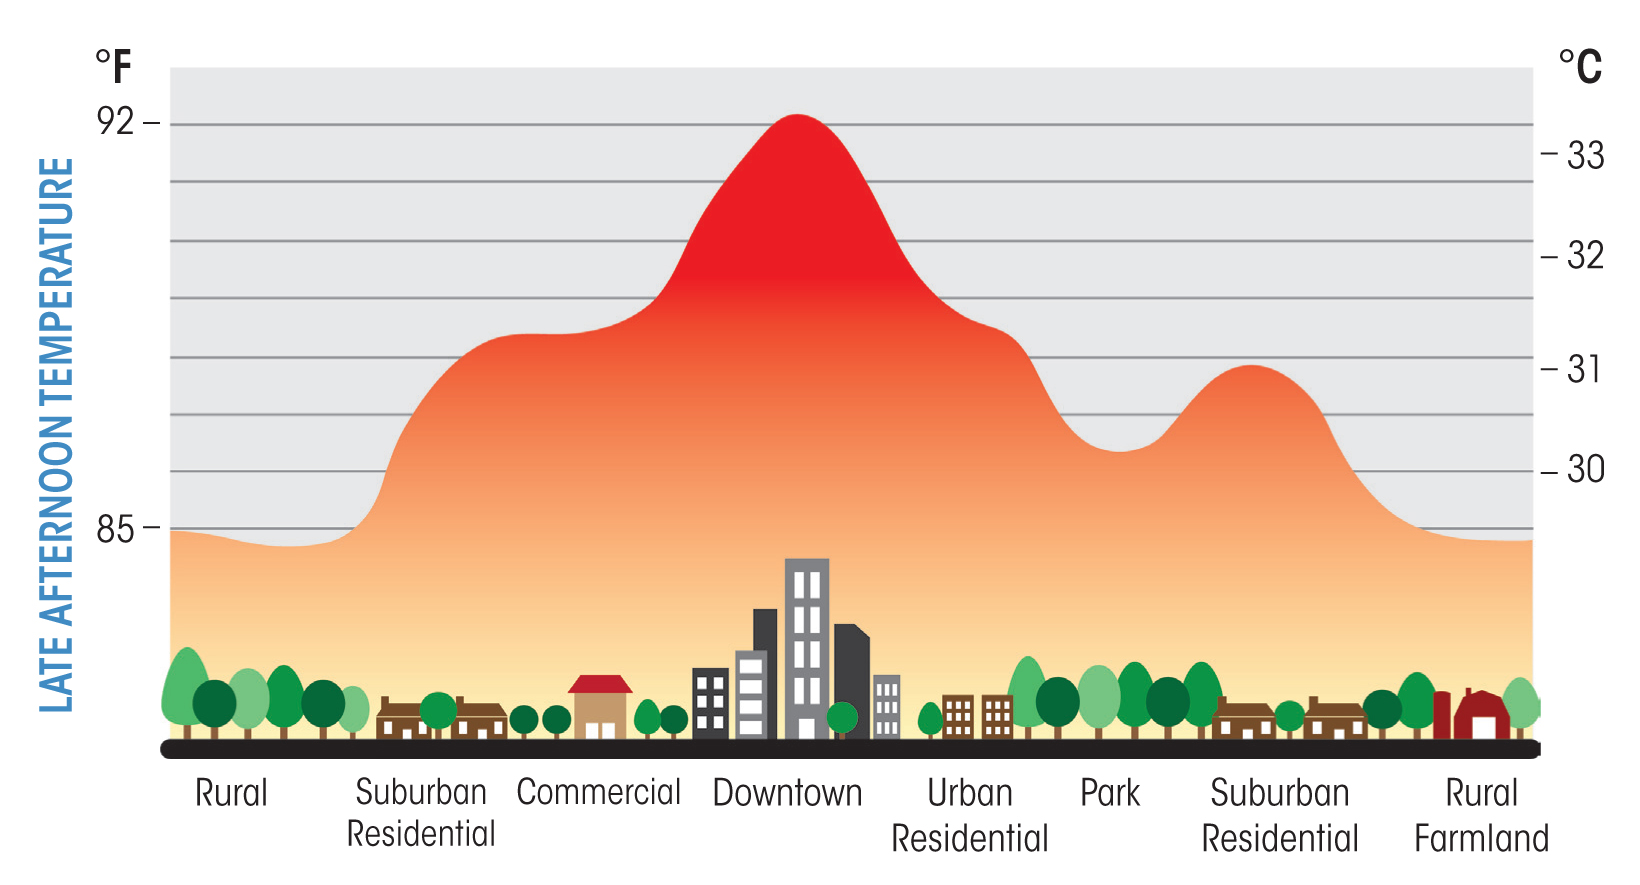
The urban heat island refers to the city center having a higher temperature than the suburb and rural areas.
Why UHI happens?
Many factors causes UHI, like reduced natural landscape, urban construction materials, heat from human activities, and others.
| UHI factors | Why they increase temperature |
|---|---|
| More dark surfaces | Absorb and retain more heat |
| Less vegetation | Less cooling in the environment |
| Human activities | Industrial production generate more heat |
UHI costs
UHI has many negative effects on our society.
| Aspects | Costs |
|---|---|
| Social | High mortality in urban area |
| Environmental | Increased energy usage (more fossil fuels and pollution) |
| Economic | GDP loss |
8.1.3 Policy solutions
Policy can provide a good direction for cities that help them to mitigate UHI effects, and the policy solutions basically can be described in the following three levels. However, all of these policies solutions have limitations. They doesn’t consider the feasibility and the specific implementations for cities.
8.1.3.1 Global
Some global policies are related to the mitigation of UHI, but they don’t have specific guidance for implementation of cities, and they are just big goals and targets.
New Urban Agenda
Point 37 We commit ourselves to promoting safe, inclusive, accessible, green and quality public spaces, including streets, sidewalks and cycling lanes, squares, waterfront areas, gardens and parks, that are multifunctional areas for social interaction and inclusion, human health and well-being.
Point 79 We commit ourselves to promoting international, national, subnational and local climate action, including climate change adaptation and mitigation, and to supporting the efforts of cities and human settlements, their inhabitants and all local stakeholders as important implementers.
Sustainable Development Goals (SDG)
Goal 11 Make cities and human settlements inclusive, safe, resilient and sustainable.
8.1.3.2 Local
Beat the heat handbook
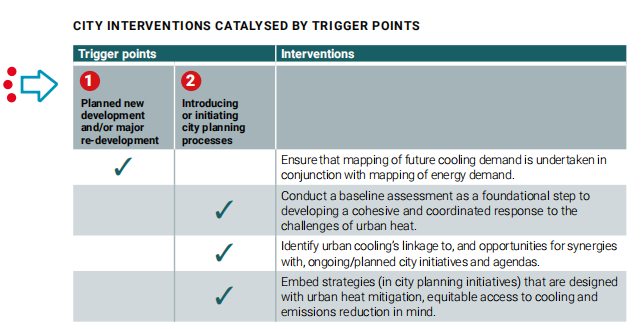
This hand book from United Nations is the first major document that has specific integration into policy. Although it has some specific interventions in the local level, the handbook is too much information for local planners and managers. Also, interventions don’t contain specific procedures and steps for city managers, and solutions to reduce the urban temperature.
Superblock in Barcelona
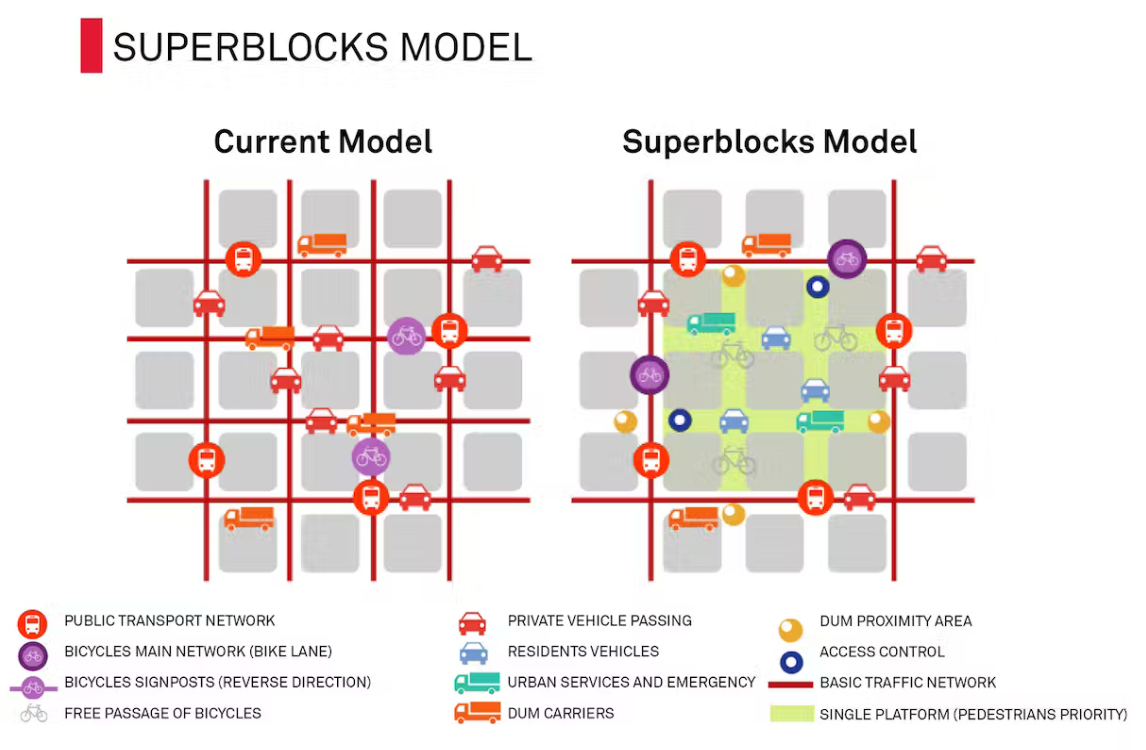
This right picture shows a superblock. In the superblock, cars are restricted or banned, this will create more spaces for walking and bicycling. Outside the superblock, the traffic speed is limited with a maximum (50km/h). This will provide more green spaces for residents and encourage people to walk and bicycle, and reduce heat, noise and pollution. The problem for this plan may cause less business because of less car, and less community support.
The video provides a really good introduction about superblock, and I think it is a nice idea in my future geographic study.
Medellín Green Corridors
This plan intends to build 36 corridors along 18 roads and waterways in the city, this will reduce 4 degrees for their temperature.

Sydney’s western suburbs
This plan assesses the current state and the future of UHI in Western Sydney, which predicts the increasing severity and frequency of heat waves, and effects on citizens.
8.1.3.3 Metropolitan
Some of metropolitan plans have a temperature reduction activities, and they can be improved in the future. There are some of potential useful ideas which may combine in the temperature reduction.
use reflective materials (like roofs, parking lots)
engage community members
better accessibility to green spaces
better planned community avoid disparities
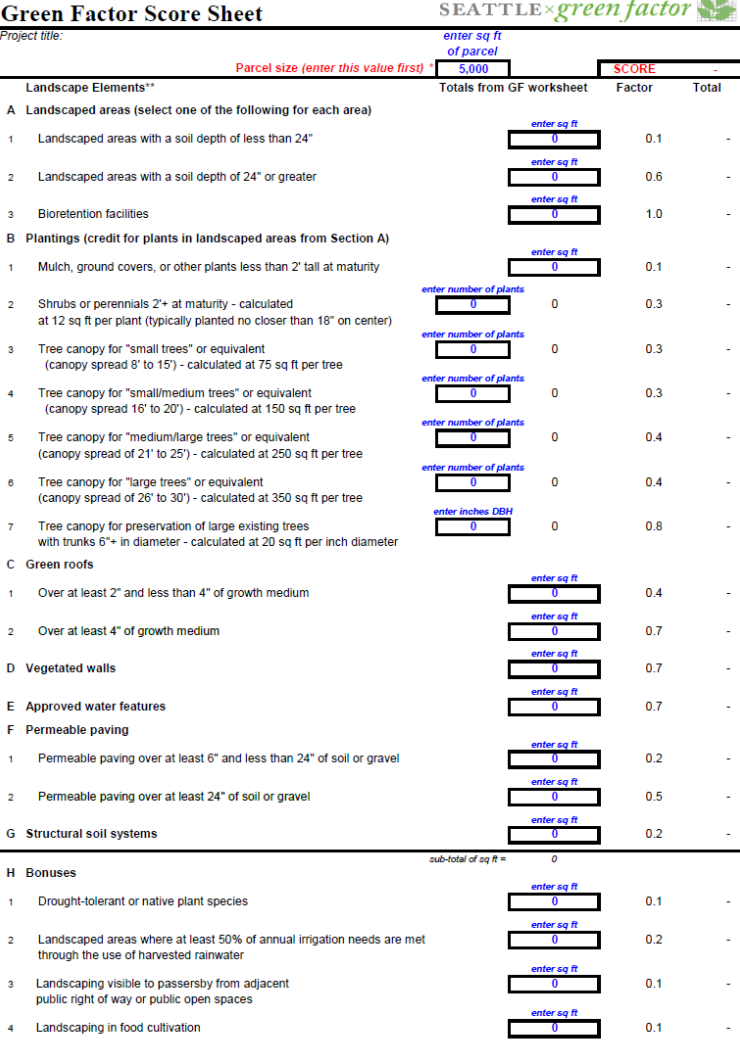
Seattle’s policy
The policy in Seattle requires all the citizens reach the minimum score established by the zoning your property, and this engages citizens to indirectly reduce the UHI. The limitation of this are no requirments about locations of green vegetation, which may have no influence on temperature reduction.
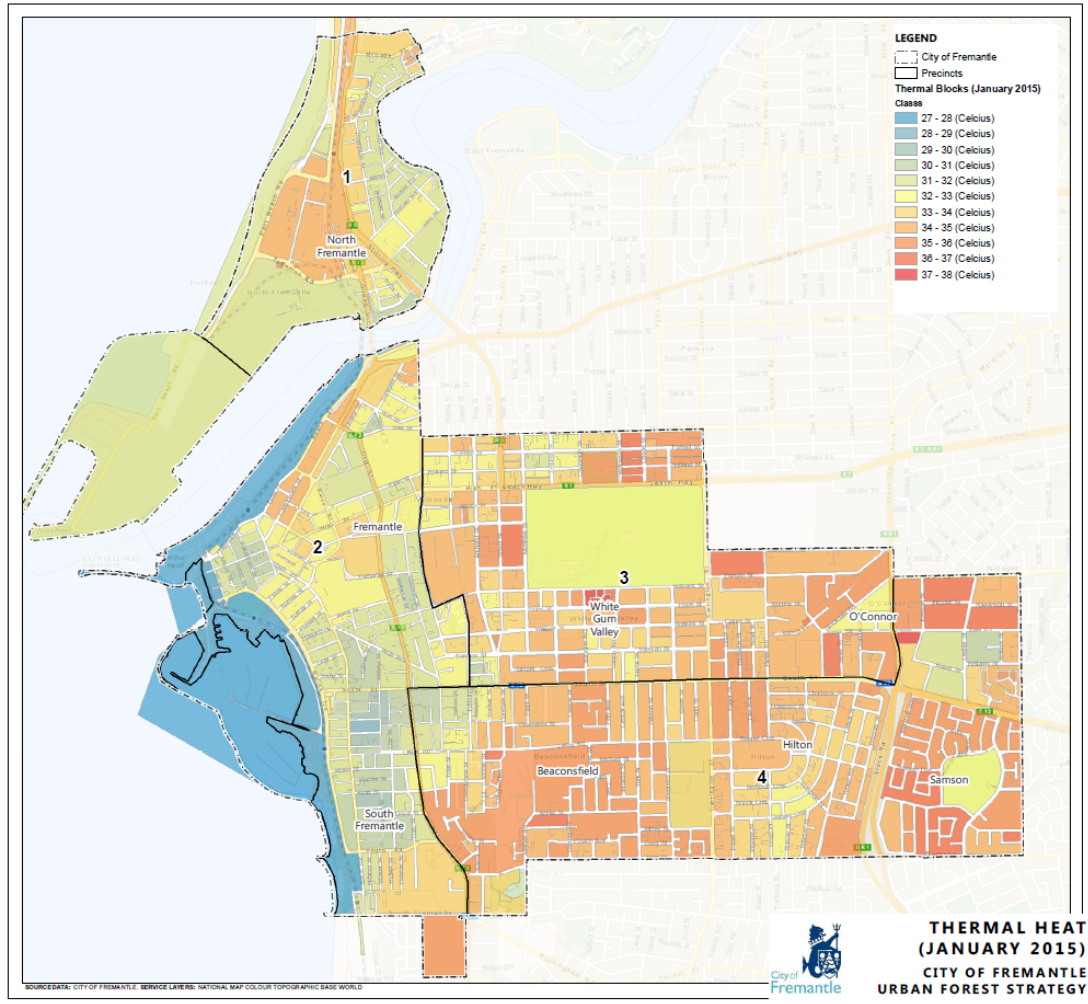
Fremantle’s Urban Forest Plan
This plan go through more details because it uses data to analyze where to increase the green spaces. In terms of limitation, it only include one month data, which may be biased. Also, the analysing scale (the block) they used are too big. For example, the temperature in block may be various, but in this case the temperature is same in each block.
8.1.4 Approaching projects
8.1.5 Temperature applications on GEE
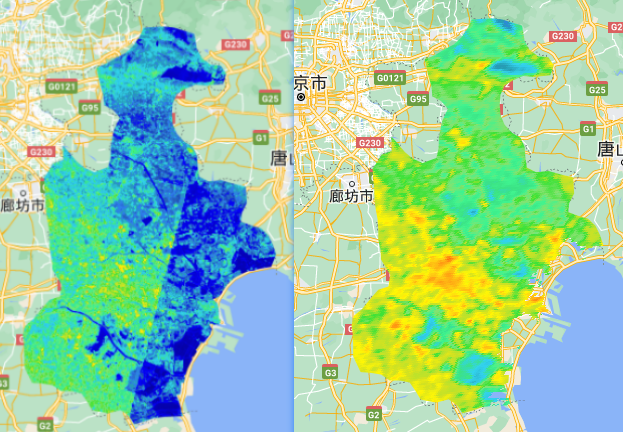
The export the temperture shapefile on GEE is useful for doing future researches. In this practical, I used both Landsat and MODIS data to generate LST data for Tianjin, China. The MODIS data is better because it can scan twice a day for the same place. The detailed steps were summarzied in the workflow.
My code link: https://code.earthengine.google.com/6492a6b735deeb5904360326cfde723e
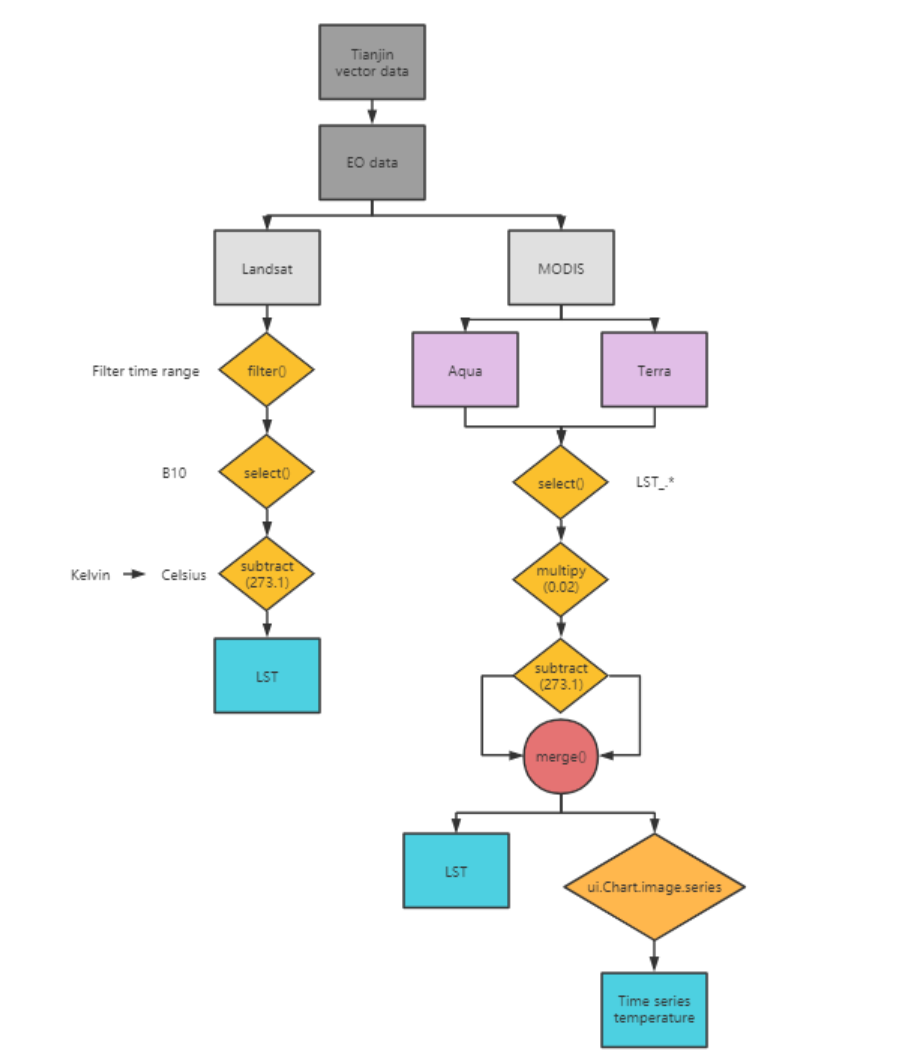
The LST from Landsat was displayed using the same palette with MODIS, so it seems not really good, and also there is a clear dividing line on the map. I guess this is because the LST data were extracted from two separated Landsat images.
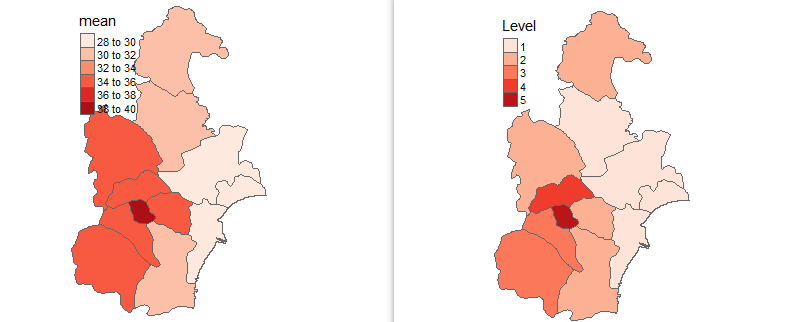
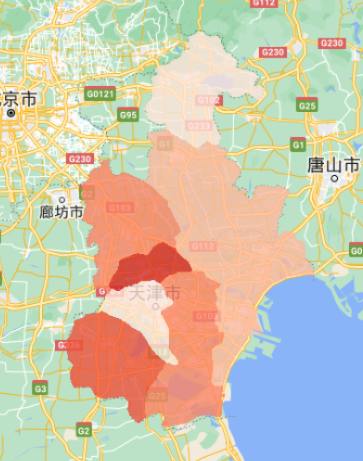
The spatial unit temperature were calculated on GEE, and then exported to shapefile using R to analyze percentile rank. The process of this step is easier in R rather than using GEE.
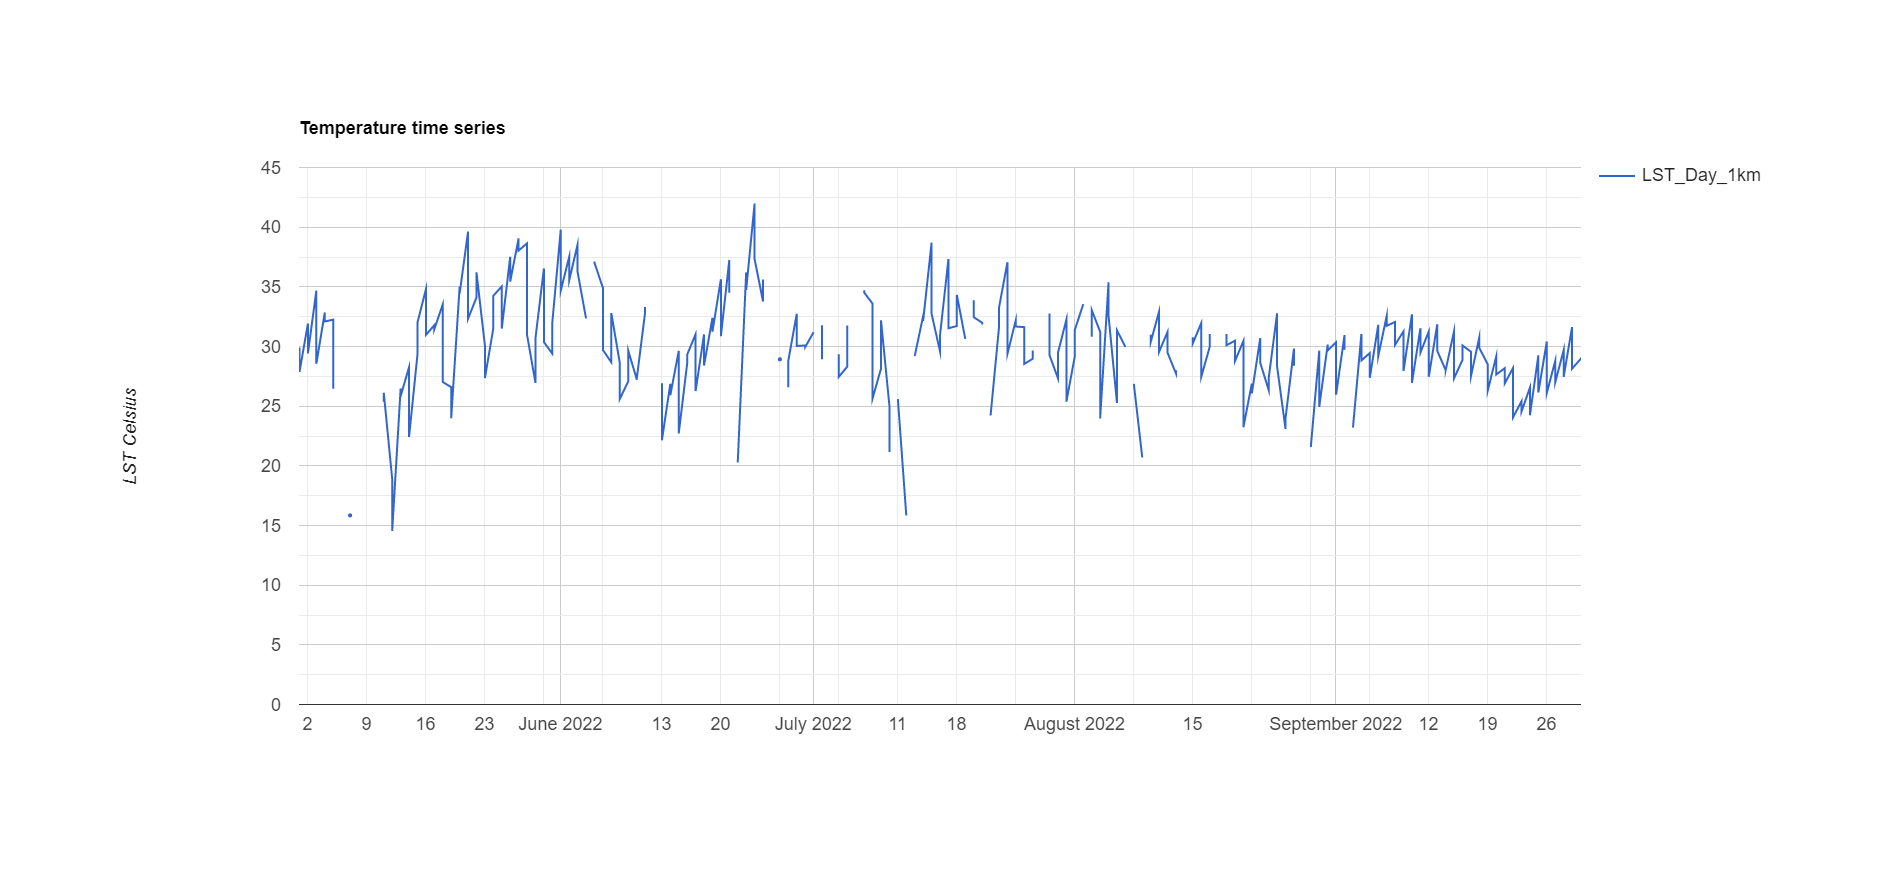
The time series chart was generated on GEE, which is quite easy.
8.2 Application
Urban heat island (UHI) is popular research topic in recent years. Some of content about UHI is covered in this week lecture and practical, but they are not enough. There are many other methods and ways that contribute to the better understanding of UHI, the estimation of UHI and mitigation of UHI effects. This application part tries to explore more about them.
8.2.1 Case1: The effects of 3D urban morphology on the UHI
In recent decades, many cities not only expand horizontally, but also develop vertically. There are many high-rise buildings located in the center of cities. The estimation of UHI in the previous paper are limited to talking about 2D urban morphology. Huang and Wang (2019a) examined a case study about the 3D urban morphology and land surface temperature (LST) in Wuhan, China. They found the dispersed high-rise building have contributions to reduce LST, and trees are the most important factor that reduces the LST in the city. In their study, they used a sky view factor (SVF) (0 no sky visible, 1 no horizon obstructions visible), mean height (MH), height variance (HV), and normalized height variance (NHV) to measure 3D information. Based on these factors, they found 3D urban morphology has effects on LST, but the relationship between them is complicated. There are many different arguments about this. I think the better understanding of UHI and the structure of our city will help urban policy mangers to generate better interventions.
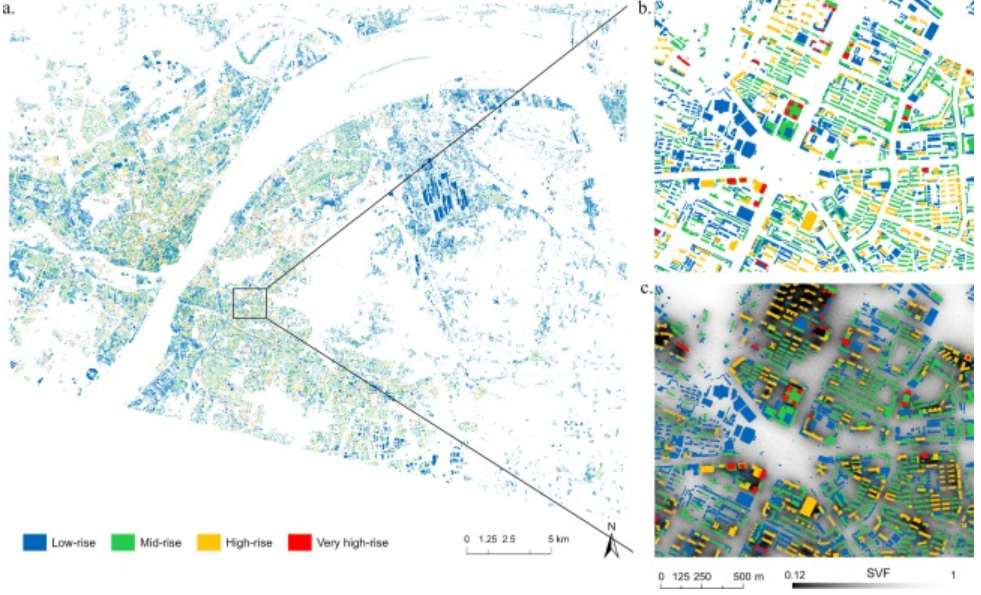
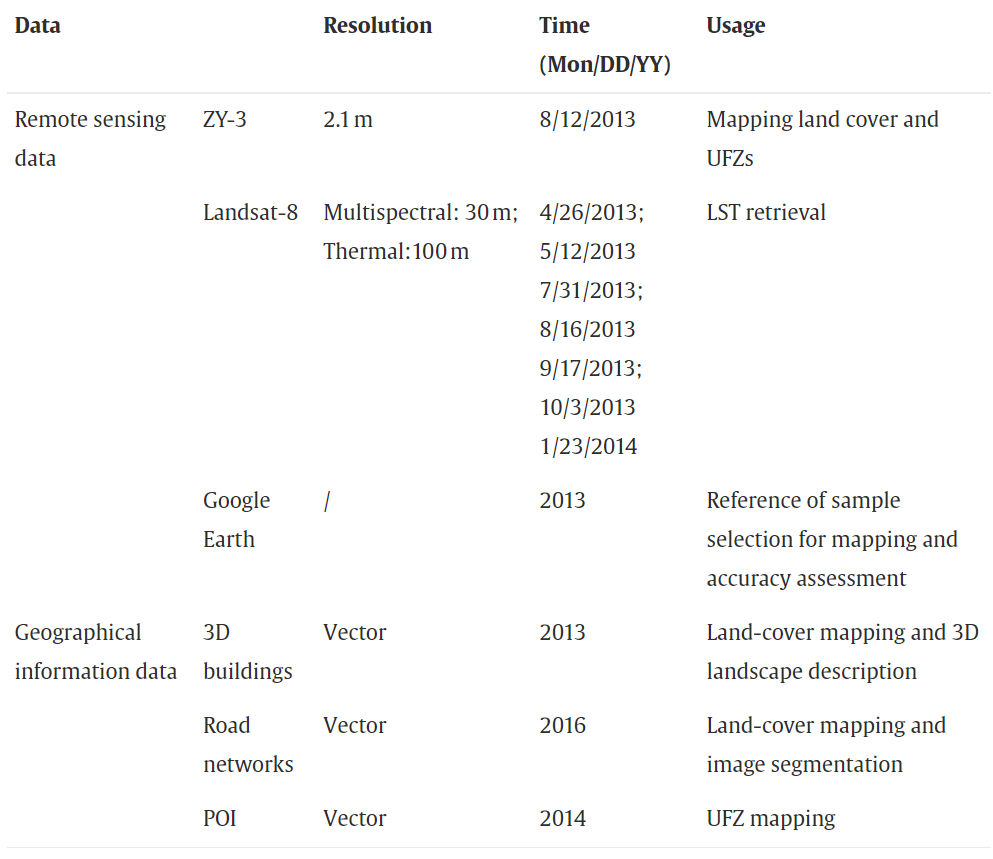
This study also used Landsat-8 to measure LST, and ZY-3 to map land cover. The ZiYuan-3 (ZY-3) is a Chinese satellite, which has 50 km swath width, 2.1 m spatial resolution, and 5.8 m multispectral scanner (Huang and Wang (2019b)). This satellite provides good spatial resolution data, which may be useful for doing some researches about Chinese cities.
8.2.2 Case2: cooling effects of city scale efforts to reduce urban heat island
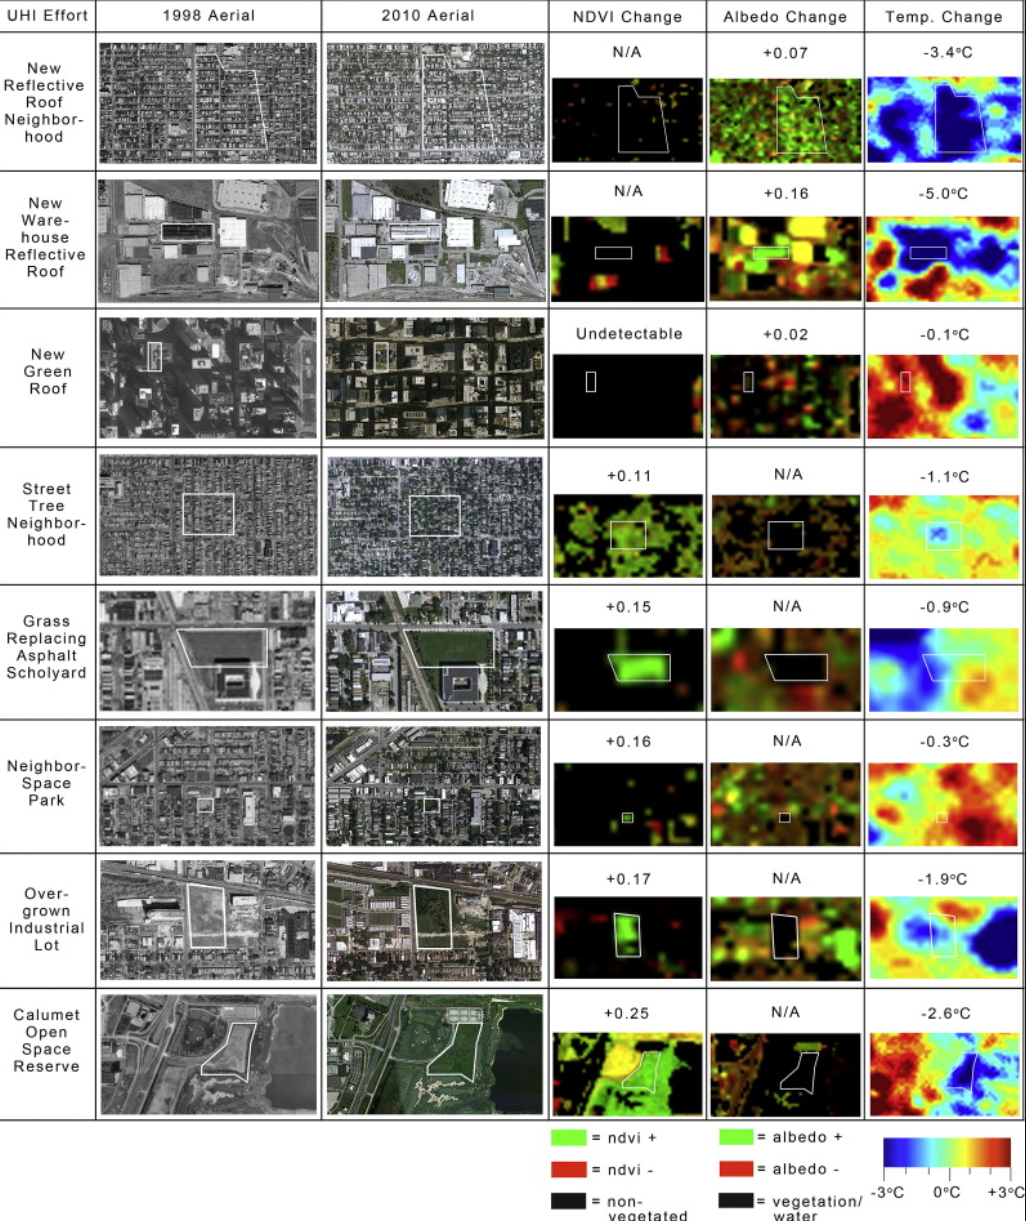
In the course content, the mitigation of urban heat island focus on using replanning of blocks and increasing green vegetation. This study provides another way applied in Chicago successfully reduce the UHI. Mackey, Lee, and Smith (2012a) proves the reflective strategies has more cooling functions than vegetation. The following figure in the study shows when the Albedo increase 0.16, the temperature will reduce 5°C. Compared to an increase of NDVI with 0.25, there are only 2.6 °C decrease. This result is different to many studies that support the vegetation is the most important factor in cooling LST. Mackey, Lee, and Smith (2012b) also mentioned this method would have the greatest cooling effects with the small investigation. Therefore, I think city managers also can consider using reflective materials if the situations of their cities are similar to Chicago.
8.3 Reflection
Urban heat island is a long-term problem and research question, and many policy solutions for the mitigation of UHI are good. But I think they can be more specific and detailed from urban forest perspective. As a previous urban forest student, their plans should include detailed implementations about tree species, tree planting, and tree management because many plans just mention we can plant trees in the planning locations, but they don’t mention how to plant a tree successfully, how to choose suitable tree species, and how to maintain trees after planting. For example, different trees will have different crown shapes and sizes, and this will affect the mitigation of temperature in the summer. Therefore, although many metropolitan plans are good, I think there are still some improvement in the future.
I like the idea of Seattle’s policy because it can engage all the residents contributing to implementation work. When I recall the urban forest interventions I completed in my undergraduate, the most difficult problem was lack of financial support and money. So in the implementation of these plans, we can make our plans more attractive for residents. This will be really helpful for the city to implement their plans and save money.
In the practical, I generated the temperature shapefile for Tianjin based on Landsat and MODIS, and this would be a really useful process for my future study. Temperature is a essentail variable in many research topics, and I think I’m able to make temperature data on any case locations and time series after this practical. Also, I will use R to do percentile rank for my temperature data becasue it is more easier than it in GEE.
The first case study in my application is interesting because it considers vertical factors of cities and their influences on temperature. In remote sensing, I think the height is easily ignored by many people, but it is really important in many cases. For example, the vertical structure of forest will provide much information about the volume of timber or the healthy of forest. Also, the height data is usually collected by LiDAR, but LiDAR data sometimes are hard to access. In addition, all the content in the lecture doesn’t mention some cases about reflective ways to mitigate UHI, so I think the second case study is a successful case that proves the feasibility of reflective materials. However, this study doesn’t mention the specific solutions and steps, which indicate how to improve the albedo.